📊 GDP Growth, Employment, and Income Inequality
A Comparison of the United States (2015–2022) and the OECD
💡 1. Research Question
How did the relationship between GDP growth, employment rate, and income inequality in the United States from 2015 to 2022 differ from the OECD?
The OECD countries experienced different paths of growth, employment, and inequality between 2015 and 2022. The United States is often described as having strong economic growth but higher inequality than other countries.
Did the relationship between GDP growth, employment, and inequality in the United States follow the OECD pattern, or did it diverge in a unique way?
🌊 2. Introduction
This study examines the relationship between GDP growth, employment rate (ages 15–64), and income inequality (Gini) from 2015 to 2022. During this period, the global economy experienced steady growth, the shock of COVID-19, and a rapid recovery.In general, economic growth is expected to create jobs and reduce inequality. However, it is not clear whether this pattern applies to the United States. In particular, even if employment increases, inequality may not always decrease. Therefore, this study directly compares the United States and the OECD average using the same period and the same indicators. By analyzing the three variables together, this research examines whether the U.S. follows the OECD pattern or shows a different structural trend. It focuses on clearly showing how growth, employment, and inequality moved during 2015–2022 and how the United States differs from the OECD.
📚 3. Background Context
Previous research suggests that income inequality can weaken long-term economic growth, especially when lower-income groups fall behind in education, investment opportunities, and consumption. At the same time, many studies argue that employment expansion may help reduce inequality by increasing labor income and improving access to economic opportunities. However, most existing research tends to analyze these relationships separately focusing either on growth and inequality, or employment and inequality — rather than examining all three variables together. In addition, many major studies were conducted before the COVID-19 pandemic, meaning they do not fully capture the structural shocks and recovery patterns between 2020 and 2022. Few studies directly compare the United States and the OECD using harmonized indicators over the same time frame. This leaves an important gap in understanding whether the U.S. follows the broader OECD pattern, or whether it operates under a structurally different economic dynamic.
📦 4. Data Overview
The dataset used in this study comes from the OECD Data Explorer portal, the offical statistical platform of the Organisation for Economic Co-operation and Development (OECD). The OECD Data Explorer provides comparable economic, labor, and social statistics from all member countries. This study focuses on three key annual indicators which are GDP growth, employment rate, and income inequality (Gini) from 2015 to 2022.
The GDP growth is calculated based on national accounts compiled by OECD member countries and represents the annual percentage change in real Gross Domestic Product (GDP). It reflects economic expansion or contraction. The employment rate is calculated from labor force survey data in each country using standard definitions adjusted by the OECD and represents the percentage of the working age population aged 15 to 64. The Gini coefficient is an indicator of income inequality and is calculated from household income survey data adjusted for comparison between countries. This value is located between 0 (complete equality) and 1 (maximum inequality) and reflects the degree of imbalance in the distribution of disposable income.
All datasets were downloaded in CSV format directly from the OECD Data Explorer and merged using R by matching the country and year variables. The final cleaned dataset includes 37 OECD member countries from 2015 to 2022, resulting in a total of approximately 273 country-year observations.
📊 5. Descriptive Patterns and Correlation Analysis
🔹 5.1 Standardized boxplot
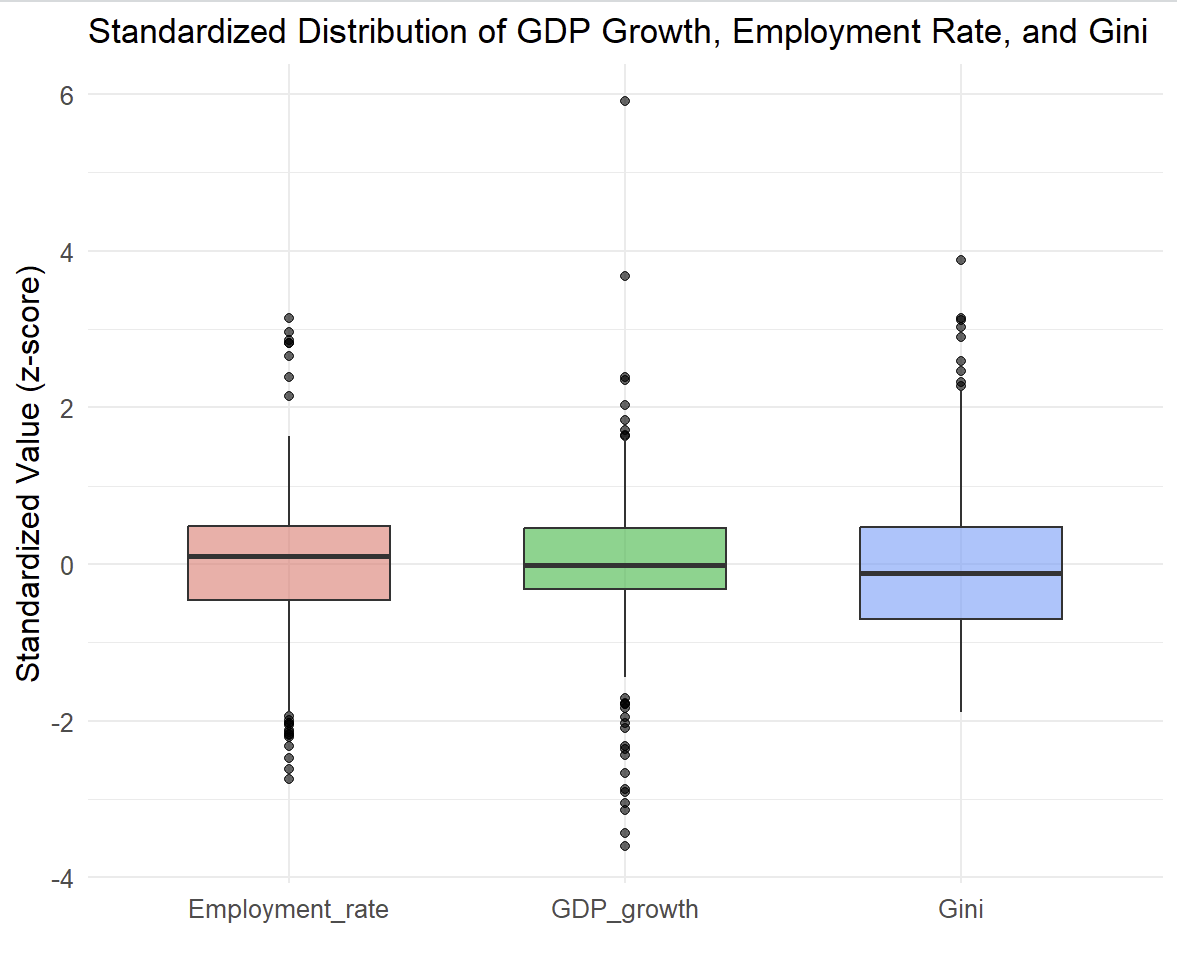
To allow meaningful comparison across variables measured in different units, all indicators were standardized into z-scores. The boxplot therefore reflects relative dispersion rather than absolute magnitude. Among the three variables, GDP growth exhibits the widest interquartile range and the most pronounced tails. Several extreme observations extend beyond ±3 standard deviations, indicating substantial short-term volatility within the sample. Employment rates show a comparatively narrower dispersion. While some outliers are present, the central mass of observations remains more tightly clustered around the mean. The Gini coefficient also displays cross-country variation, but its distribution appears more compact relative to GDP growth, suggesting that inequality varies across OECD economies within a more structurally bounded range. Overall, the standardized distribution indicates that GDP growth captures greater short-term fluctuation, whereas employment and income inequality demonstrate comparatively more stable cross-country patterns.
🔹 5.2 Employment Rate and GDP Growth
The scatter plot shows a weak positive relationship between employment rate and GDP growth across OECD countries. As employment increases, GDP growth tends to rise slightly. However, the relationship is not strong, and there is considerable dispersion in growth outcomes even among countries with similar employment levels. This suggests that while labor market expansion may support economic growth, employment alone does not fully explain variations in GDP performance across countries.
🔹 5.3 Income Inequality (Gini) and GDP Growth
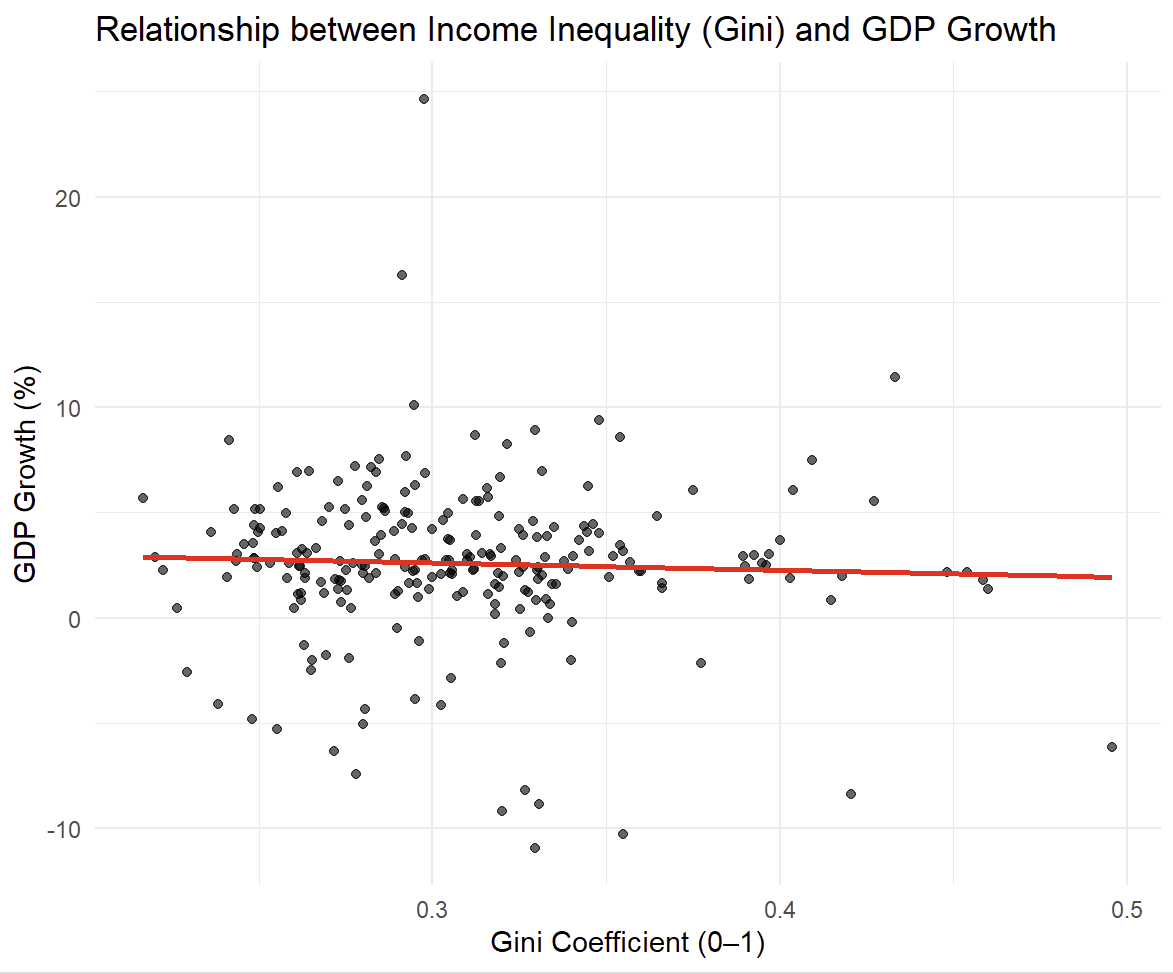
The relationship between income inequality and GDP growth appears close to neutral or slightly negative. The regression line is relatively flat, indicating that higher inequality does not systematically correspond to higher or lower growth during this period. This finding challenges the assumption that growth automatically reduces inequality or that inequality necessarily drives growth. Instead, growth dynamics seem to operate somewhat independently from income distribution patterns.
🔹 5.4 Employment Rate and Income Inequality
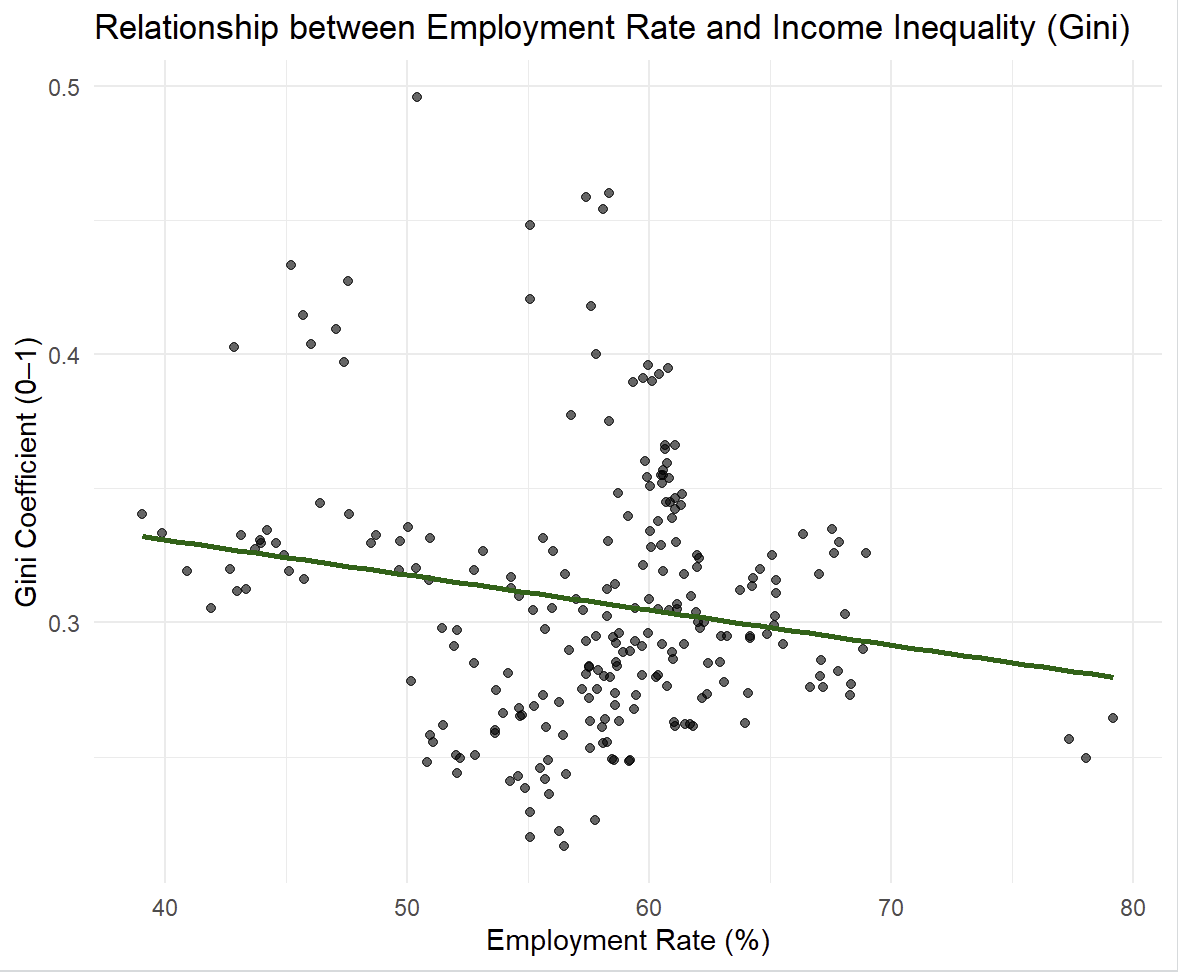
In contrast, the relationship between employment rate and income inequality reveals a clear negative association. Countries with higher employment rates generally tend to exhibit lower Gini coefficients. This suggests that labor market participation plays an important role in moderating income inequality within OECD economies.
This pattern represents the broader OECD structural tendency:
Higher employment → Lower inequality
This OECD-wide relationship serves as a baseline for evaluating whether the United States follows the same structural pattern or diverges from it.
🏛️ 6. The United States Structural Divergence from the OECD
🔹 6.1 OECD Economic Structure in PCA Space
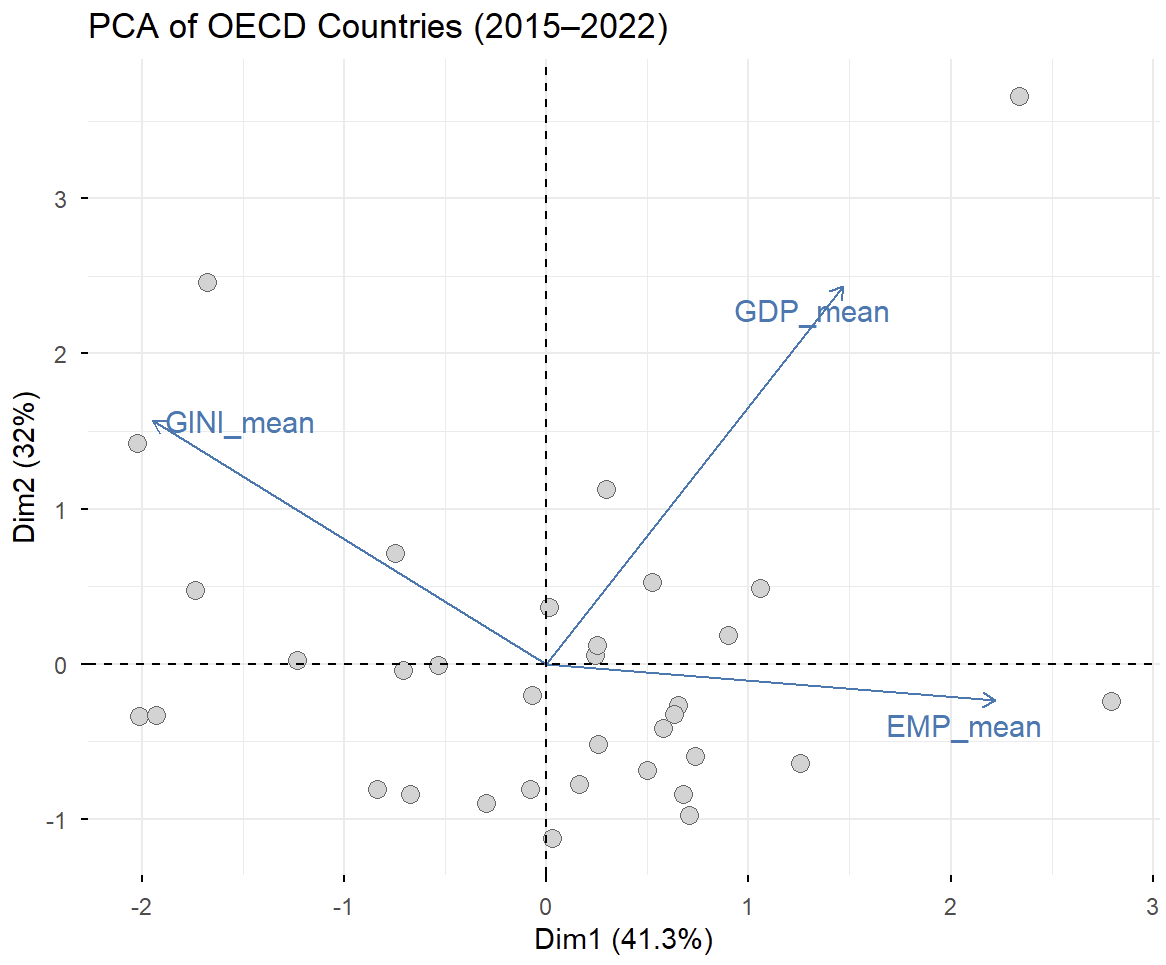
Based on the explained variance ratios, the first two principal components account for approximately 73% (PC1: 41.3% + PC2: 32%) of the total variability in GDP growth, employment rate, and income inequality across OECD countries. This proportion captures a substantial amount of the underlying structure, making a two-dimensional PCA representation reasonably informative for summarizing cross-country differences.
The direction and length of the variable vector shown in Biplot represent the degree to which each indicator explains the variance between countries. First, the GDP growth rate is strongly aligned with the first principal component (Dim1), indicating that countries with high GDP volatility and high growth rates are mainly on the right side of Dim1. On the contrary, the employment rate has a relatively short vector with a nearly horizontal direction, meaning that the employment rate is not as strong as GDP or Gini.
In addition, the Gini index extends with a distinct negative slope in the direction of Dim2, which shows that income inequality acts as an important axis in distinguishing structural differences between countries. In other words, countries with higher levels of income inequality appear in the upper left direction in the PCA space, and countries with lower inequality are located close to the lower right.
🔹 6.2 The United States in PCA Space
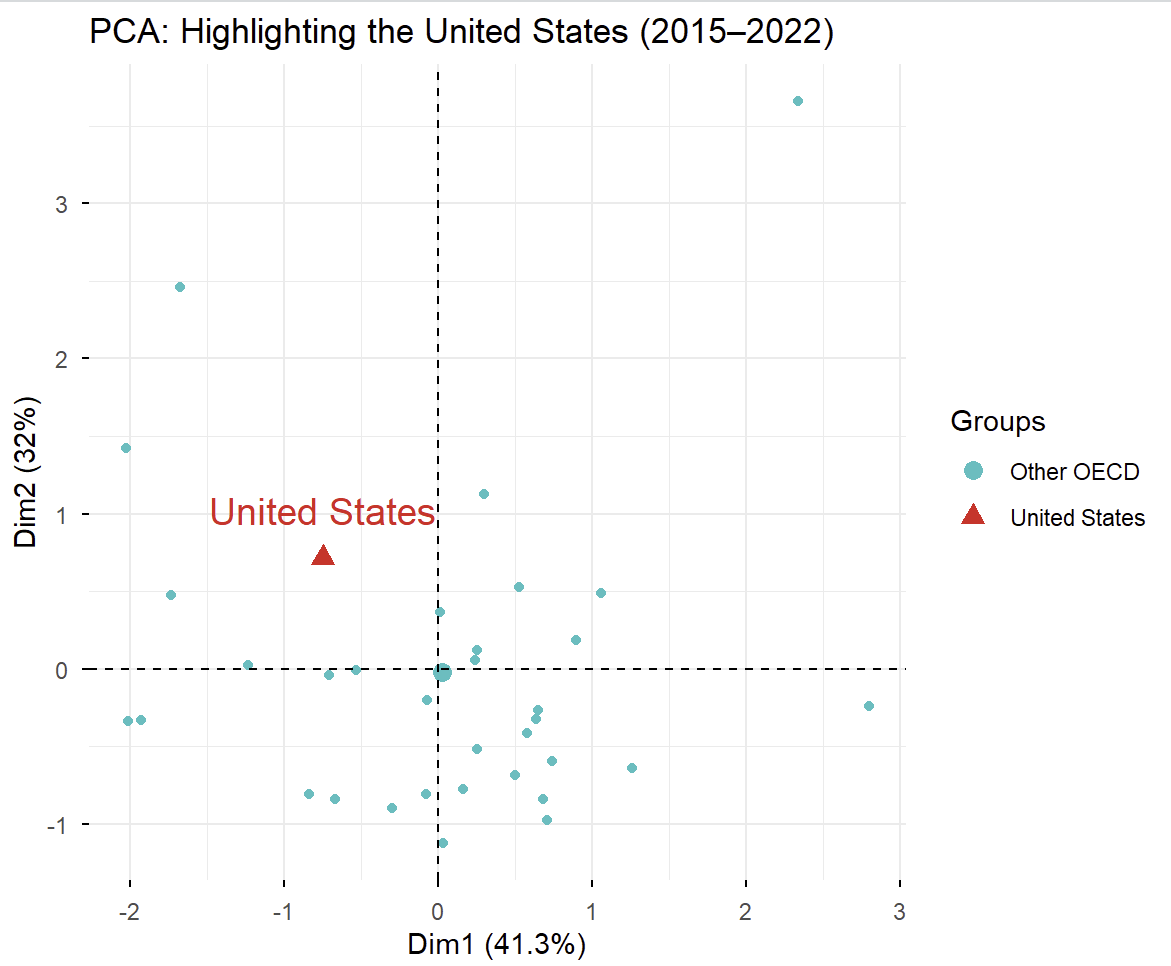
The United States is located higher than other OECD countries, indicating that income inequality (Gini) in the United States is relatively high. On the other hand, along the Dim1 axis, it is close to the center, meaning that the GDP growth rate or employment rate is not significantly different from the OECD average. In other words, the United States appears to be a country that is distinguished from other countries by the degree of inequality rather than growth and employment. For this reason, the United States occupies an independent position in the PCA space, slightly away from the areas where most countries are gathered. Overall, the United States is interpreted as the country with clearest structural differences in terms of inequality within the OECD.
🔹 6.3 Cluster Structure of OECD Countries
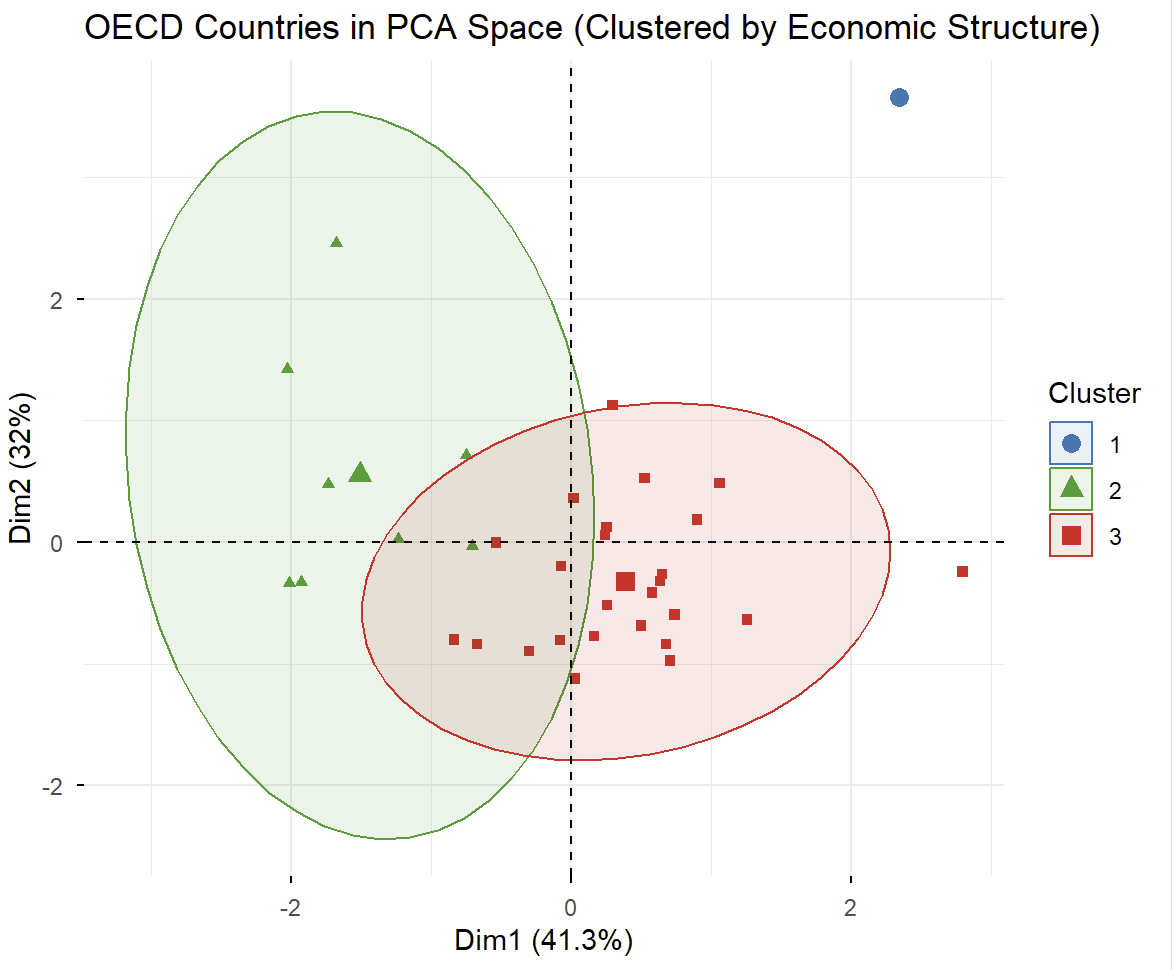
This graph shows the results of dividing OECD countries into three clusters based on PCA coordinates. The two ovals represent the typical area that each cluster occupies in the PCA space, indicating that countries in the same group share a similar economic structure. The green cluster includes countries with relatively high levels of inequality and larger fluctuations in growth rates. The red cluster includes countries with more stable employment and growth rates. Cluster 1 represents a unique case separated from the others because its economic structure differs significantly from the rest. Overall, each cluster exhibits a clearly distinguishable pattern based on the combination of economic indicators.
🔹 6.4 U.S. Gap from the OECD Average
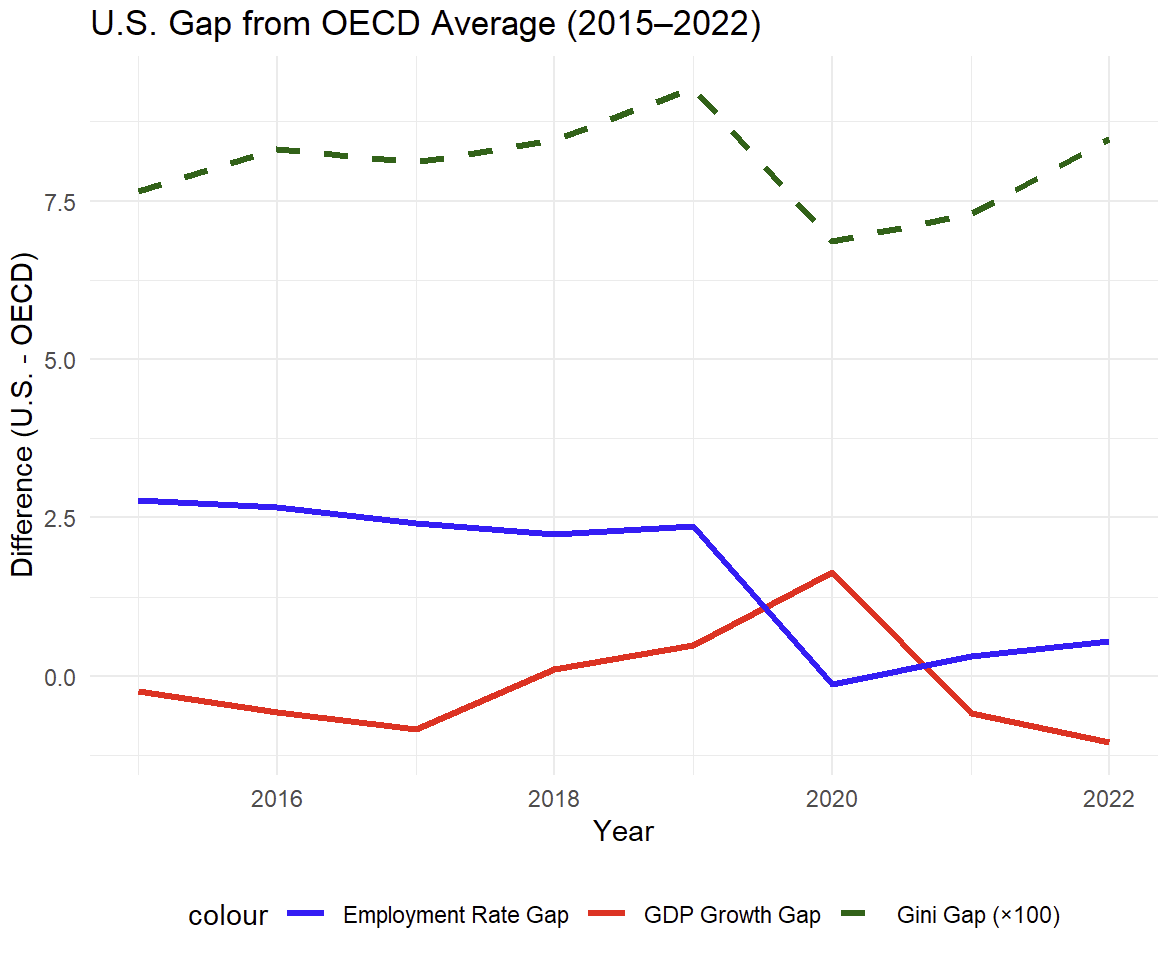
This graph shows how the United States differs from the OECD average in GDP growth, employment rate, and income inequality. The employment gap (blue) shows that the U.S. had consistently higher employment than the OECD average before 2020 and then recovered slightly after the pandemic. The GDP growth gap (in red) was not significantly different from the OECD average for most of the period, and shows that the United States received a greater economic shock in 2020 alone. In contrast, the Gini gap (green) remained significantly higher than the OECD average in the United States throughout the entire period. Overall, the most important feature is that the US is similar to the OECD average in growth and employment rates, but the Gini gap continues to be structurally very large.
🔹 6.5 Correlation Patterns in the United States
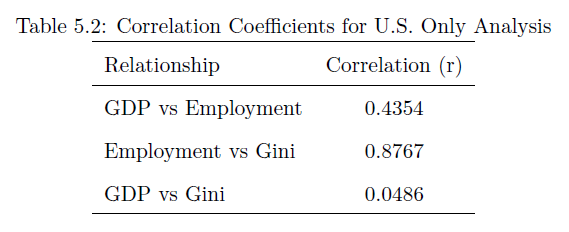
As a result of analyzing the correlation between GDP, employment rate, and Gini using only US data, GDP growth rate and employment rate showed a weak positive correlation (r = 0.435). However, it is difficult to say that it is a clear pattern. In contrast, the employment rate and Gini showed a very strong positive correlation (r = 0.877), which means that as employment increases, income inequality tends to increase at the same time. This is the opposite of the weak negative correlation (employment increase and Gini reduction) observed across the OECD. Lastly, the correlation coefficient between GDP growth and Gini was r = 0.049, suggesting virtually no association between the two variables. These results show that the United States has a unique structural connection between employment and inequality and works differently from the OECD average pattern.
🧠 7. Conclusion
This study aimed to compare and analyze how the relationship between GDP growth, employment rate, and income inequality (Gini) differs between the United States and the OECD during the period 2015–2022.
First, in the correlation analysis results using all OECD data, only a weak negative correlation between employment rate and Gini was statistically significant (rejecting H2). This means that in OECD countries, income inequality tends to decrease as employment increases. In contrast, there was no significant relationship between GDP-employment (H1) and GDP-Gini (H3). Therefore, it was confirmed that growth and distribution did not have a consistent structural connection at the OECD level as a whole.
Second, in the PCA analysis, OECD countries were classified into three distinct clusters according to GDP, employment rate, and income inequality. Among them, the United States is located in the high Gini direction (Dim2 positive direction) in the PCA space and shows a unique structure of inequality that distinguishes it from other countries. This means that the way inequality is formed and changes in the United States works very differently compared to the general pattern observed in other OECD countries
Third, as a result of comparing the annual gap between the US and OECD average, the GDP growth rate moved similarly for most of the period and the employment rate was not significantly different. However, there was a slight difference in the rate of recovery after the pandemic. On the other hand, Gini maintained that the US was consistently higher than the OECD average throughout the analysis period, and the gap remained structurally large. This means that the US has a fundamentally different inequality system from the OECD in the long run.
Finally, in the single country correlation analysis conducted only on the United States, the opposite result was observed to the OECD. In particular, there was a very strong positive correlation (r = 0.877) between the employment rate and Gini. This shows that unlike the OECD’s tendency to reduce inequality as employment increases, in the United States, inequality expands as employment increases. The GDP-employment (r = 0.435) relationship was not clear with a weak positive correlation, and GDP-Gini (r = 0.049) showed almost no correlation.
Overall, this study shows that the US economy is relatively similar to the OECD average in macro-level trends such as GDP growth and employment rates, but has a distinctly independent pattern in structural mechanisms related to income inequality. In particular, the strong positive correlation between employment and inequality in the United States is likely the result of a combination of labor market systems, wage distribution, industrial structure, and welfare systems.
These findings suggest that the US economic policy cannot solve inequality problems simply by promoting growth or expanding employment. Therefore, a separate policy approach different from that of the OECD is needed. This study is also significant in that it reexamines the structural characteristics of the US economy from an international comparison perspective.