🦟 Malaria Risk Area Identification and Contributing Factor Analysis in South Korea
🌍 1. Background
In 2023, malaria cases in South Korea increased sharply, and infections were reported even in Seoul. At the same time, the World Health Organization (WHO) warned that climate change is making malaria elimination more difficult.
📈 1.1 Increase in Malaria Cases
The total number of confirmed malaria cases reached 747 in 2023, representing a 77.9% increase compared to 420 cases in 2022.
Although malaria cases had generally declined over the past decade, the trend reversed after 2021 and began to rise rapidly. The sharp increase between 2022 and 2023 indicates a meaningful change, emphasizing the need for strengthened malaria prevention and management.
🗺 1.2 Expansion of Affected Areas
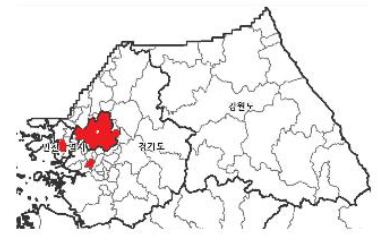
Malaria cases have begun to appear in Seoul.
As of August 2024, a total of 15 malaria cases were reported in Seoul, and three of them were estimated to have been locally transmitted. For the first time this year, Seoul was included in the official malaria alert areas, and five districts were newly designated as high-risk areas, leading to the implementation of response measures.
🌡 1.3 Increase in Mosquito Activity Due to Climate Change
With climate change, mosquito activity has increased, and malaria has become a serious global issue. According to the World Health Organization (WHO), there were 249 million malaria cases worldwide in 2022, representing a 6.9% increase compared to 2019 before the COVID-19 pandemic.
The WHO has warned that climate change is making malaria elimination increasingly difficult.
💡 2. Research Question
Which districts in South Korea are structurally high-risk for malaria, and what climatic and regional factors explain their spatial distribution?
This study aims to move beyond simple case counts and identify whether malaria risk follows identifiable structural patterns across districts.
🎯 3. Research Motivation & Objective
Malaria control in South Korea faces several emerging challenges.
First, studies have reported increasing resistance to insecticides among mosquito populations, suggesting that traditional control strategies may become less effective over time.
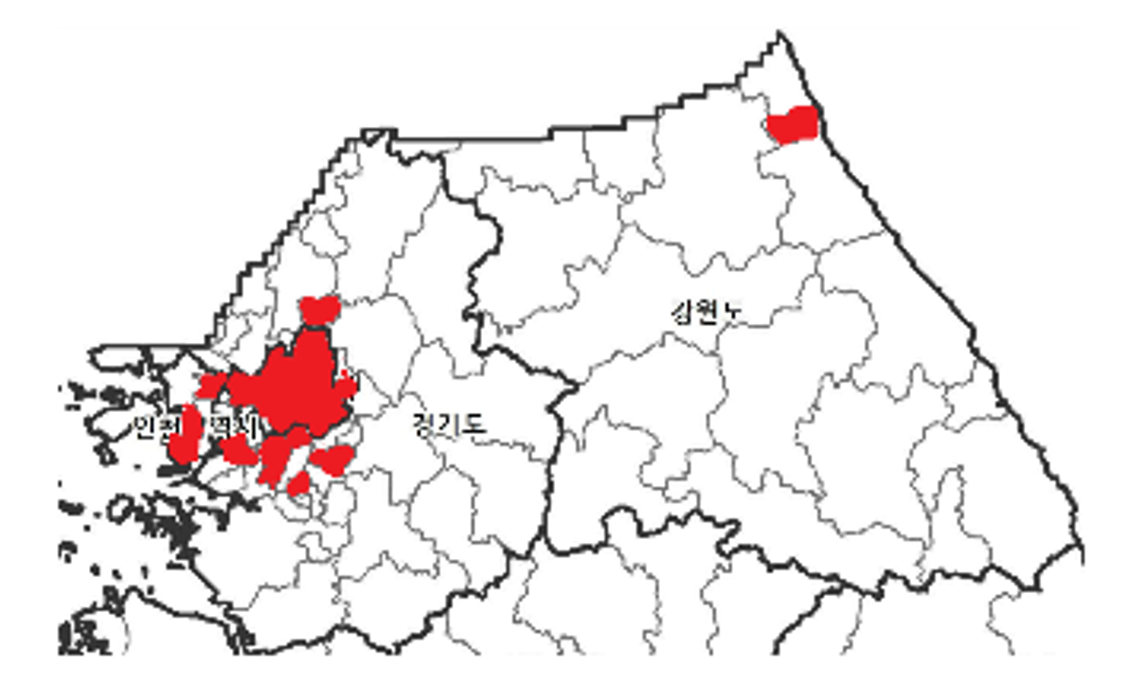
Second, more than 90% of domestic malaria cases are concentrated in specific regions, particularly near northern border areas. This strong geographic concentration indicates that malaria risk is not randomly distributed.
Third, the government recently announced the Second National Malaria Elimination Plan (2024–2028), aiming to strengthen nationwide surveillance and prevention strategies. However, more precise district-level risk identification is required to allocate resources efficiently.
Based on these considerations, this study seeks to:
- Identify key contributing factors of malaria incidence at the district level
- Structurally classify high-risk regions
- Provide evidence for targeted prevention and resource allocation
🔎 4. Analytical Framework
The overall analytical process consists of two major stages:
4.1 Data Collection and Preprocessing
- Collection of district-level data including population, land use, agricultural area, temperature, precipitation, humidity, malaria incidence, income, mobility, and healthcare resources.
- Integration of datasets into a unified panel structure
- Removal of outliers and missing values
- Application of scaling techniques
- Construction of derived variables (e.g., ratios and density measures)
4.2 Data Analysis
The analysis proceeds in three steps:
- Spatial Shift Analysis
- Calculation of annual mean geographic centers (2001–2023)
- Visualization of movement patterns over time
- Regional and Temporal Factor Analysis (2017 vs 2023)
- Principal Component Analysis (PCA) for dimensionality reduction
- Clustering using K-Means and DBSCAN
- Decision tree and multiple regression analysis by cluster
- Risk Index Construction
- Standardization of relevant indicators
- Calculation of a malaria risk index
- Identification of top and bottom five districts
This framework allows for both structural interpretation and policy-relevant insight.
📦 5. Dataset Overview
The data used in this study were collected from official Korean statistical and public data sources, including malaria incidence records, meteorological statistics, agricultural land data, livestock statistics, demographic data, mobility data, healthcare workforce statistics, and geographic coordinate data.
The analysis focuses on district-level observations within Seoul, Gyeonggi, Incheon, and Gangwon, where the majority of domestic malaria cases are concentrated.
🗺 5.1 Spatial Movement Analysis
Structure:
- Province
- District
- Annual malaria cases (2014–2023)
- Latitude
- Longitude
This dataset contains yearly malaria incidence data and geographic coordinates for each district.
It was used to examine changes in spatial distribution over time.
⚠ 5.2 Risk Area Selection
Structure:
- Province
- District
- Malaria cases (2023)
- Healthcare workforce (2022)
- Floating population (2020)
This dataset includes recent incidence data and selected structural indicators.
It was used to compare districts and identify risk areas.
📈 5.3 Determinant Analysis
Structure:
- Province
- District
- Livestock count
- Sex ratio
- Population density
- Average temperature
- Precipitation
- Paddy field area
- Regional area
- Malaria cases
- Paddy field ratio
- Latitude
- Longitude
This dataset integrates environmental, demographic, and agricultural variables with malaria incidence data.
📊 6. Analysis
🗺️ 6.1 Spatial Shift of Malaria Incidence Over Time
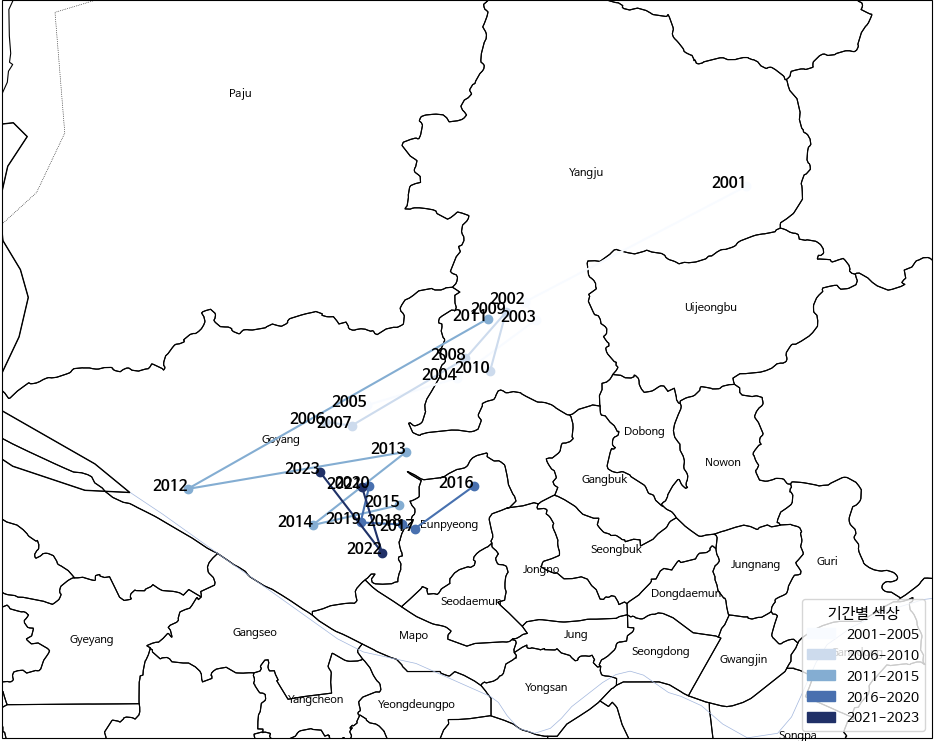
To identify temporal changes in the spatial concentration of malaria incidence, the annual weighted mean center was calculated from 2001 to 2023 using district-level case counts and geographic coordinates. In 2001, the weighted mean center was clearly located in the northeastern inland area, around the Yangju region. This indicates that malaria cases were strongly concentrated in the northern border-adjacent districts at the beginning of the study period. From 2002 to around 2010, the centroid shifted southwest toward the Uijeongbu–northern Goyang corridor. The movement during this period shows a gradual transition away from the far northeastern inland area and toward the northwestern part of the Seoul metropolitan region. Around 2012, the centroid moved further west compared to previous years, reaching its most southwestern position in the observed period. This suggests a temporary increase in case concentration toward the western Gyeonggi area. After 2013, the mean center shifted back slightly eastward and became more tightly clustered around the Goyang–Eunpyeong boundary area. From 2014 onward, the annual centroids appear concentrated within a relatively small spatial range, indicating stabilization of the core incidence zone. By 2023, although total malaria cases increased nationally, the weighted mean center remained within this northwestern metropolitan corridor rather than returning to the original northeastern inland position observed in 2001. Overall, the enlarged map confirms a clear long-term spatial shift: malaria incidence moved from a northeastern border-focused concentration toward a more stable northwestern metropolitan-adjacent cluster.
📅 6.2 Selection Criteria for Reference Years (2017 and 2023)
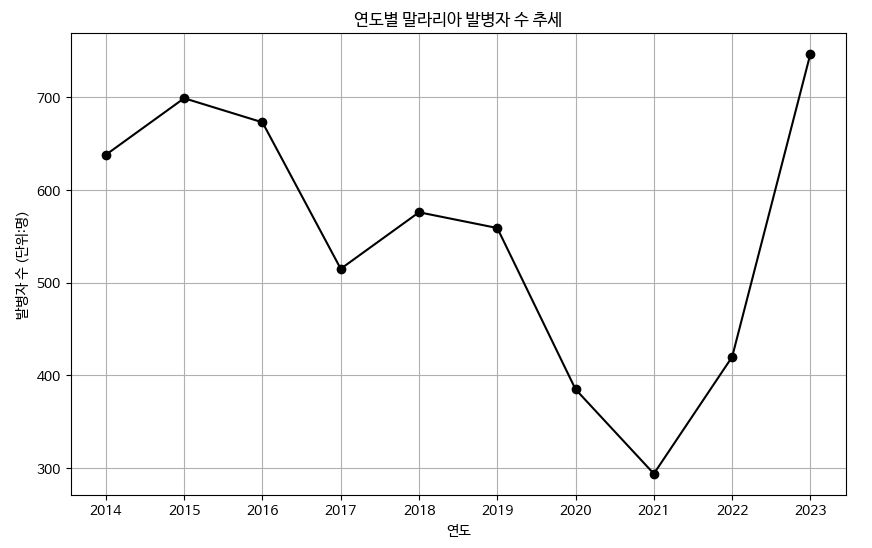
To examine structural differences in malaria incidence under contrasting conditions, two reference years were selected: 2017 and 2023. As shown in the annual trend graph, malaria cases remained relatively stable between 2014 and 2019, followed by a sharp decline during 2020–2021, likely associated with reduced mobility and public health interventions during the COVID-19 pandemic. In 2017, malaria incidence was comparatively low within the pre-pandemic period, representing a stable baseline condition before major external disruptions. In contrast, 2023 shows a dramatic surge in cases, marking the highest level in the observed period. This sharp increase reflects a post-pandemic rebound and suggests the influence of structural and environmental factors beyond temporary mobility restrictions. Therefore, 2017 and 2023 were selected as analytical reference points to compare malaria determinants under stable versus outbreak conditions.
🧩 6.3 Regional Structural Classification
To identify structural differences in malaria incidence across districts, dimensionality reduction and clustering analysis were conducted. First, Principal Component Analysis (PCA) was applied to reduce the dimensionality of the dataset and capture the major variance structure among environmental, demographic, and agricultural variables. The cumulative explained variance analysis showed that five principal components explain approximately 92% of the total variance, indicating that the main structure of the dataset can be represented with a reduced number of components. Based on these transformed features, clustering analysis was performed to identify districts with similar structural characteristics.
Two clustering algorithms, K-Means and DBSCAN, were tested. The Elbow Method was used to determine the optimal number of clusters for K-Means, and the results indicated that three clusters (k = 3) provided the most appropriate grouping of districts. Although DBSCAN was also applied, it produced only a single cluster under the selected parameter settings, making it unsuitable for distinguishing meaningful regional patterns. The Silhouette Score of the K-Means model was approximately 0.26, suggesting a moderate but interpretable level of separation among clusters. Therefore, K-Means clustering with three clusters was selected for the final regional classification, and the characteristics of each cluster are analyzed in the following section.
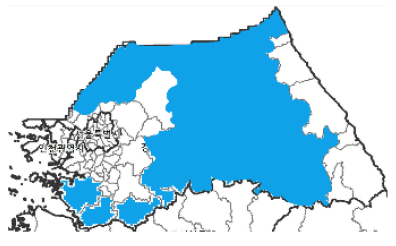
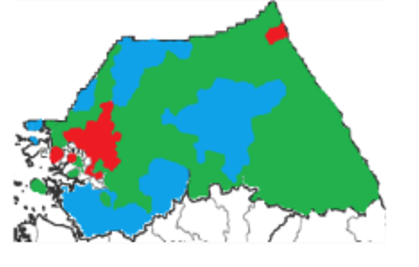
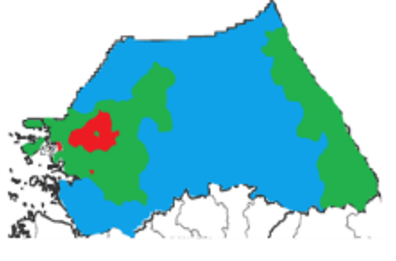
📍 6.4 Cluster 1: Urban-Adjacent Regions
2017 |
2023 |
Cluster 1 mainly consists of districts located near the Seoul metropolitan area. These regions are characterized by high population concentration and strong urban influence compared to surrounding rural areas. The spatial distribution of this cluster indicates that malaria cases tend to appear in urban-adjacent districts rather than in purely rural agricultural regions. In particular, several districts around the Seoul metropolitan area form a concentrated spatial pattern of malaria incidence. Comparing the two reference years shows that the spatial distribution of this cluster slightly changed over time. In 2017, malaria cases were concentrated in several districts surrounding Seoul. In 2023, the cluster remained largely centered around the metropolitan region, but the spatial pattern became slightly more localized. Overall, Cluster 1 represents urban-adjacent regions where malaria occurrence is associated with metropolitan environmental conditions rather than purely agricultural landscapes.
📍 6.5 Cluster 2: Agricultural Regions
2017 |
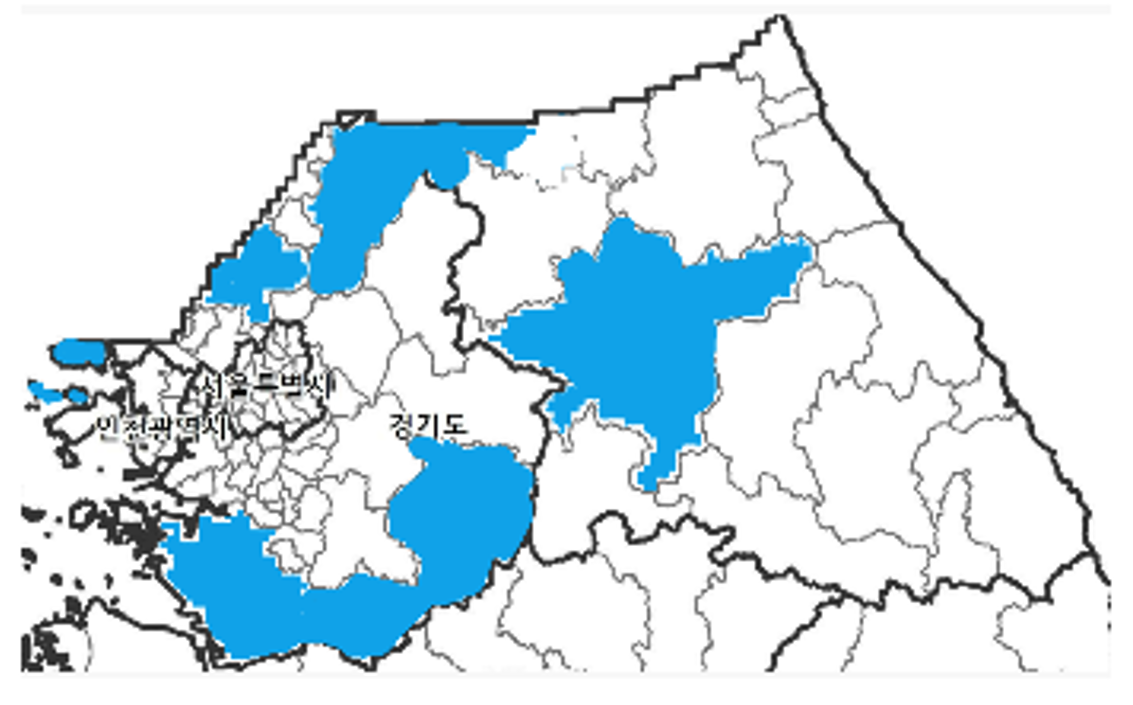
2023 |
Cluster 2 consists primarily of districts characterized by extensive agricultural land use. These regions are mainly located outside the metropolitan core and include areas with large rural landscapes and farming activities. In 2017, districts belonging to this cluster were distributed across several agricultural regions surrounding the metropolitan area as well as in northern and eastern parts of the study region. The spatial pattern indicates that malaria cases were associated with rural districts that have strong agricultural land-use characteristics. By 2023, the spatial distribution of Cluster 2 became more concentrated in large agricultural areas, particularly in eastern and southern regions. Compared with 2017, the cluster expanded spatially and formed a more continuous agricultural zone. Overall, Cluster 2 represents agricultural regions where malaria incidence is spatially associated with rural land-use structures and farming landscapes.
📍 6.6 Cluster 3: Livestock and Socioeconomic Regions
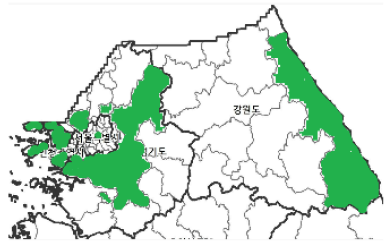
2017 |
2023 |
Cluster 3 consists of districts located mainly in rural and peripheral areas of the study region. These districts are generally characterized by lower population density and broader rural landscapes compared to the metropolitan districts. In 2017, the spatial distribution of this cluster appeared in several scattered districts, particularly in eastern and peripheral areas. The cluster represented rural regions that were spatially separated from the metropolitan core. By 2023, the spatial pattern of Cluster 3 became more extensive and continuous, especially across large areas in the eastern part of the study region. Compared with 2017, the cluster expanded spatially and formed a broader rural zone. Overall, Cluster 3 represents rural regions where malaria incidence is associated with broader regional characteristics rather than metropolitan or purely agricultural environments.
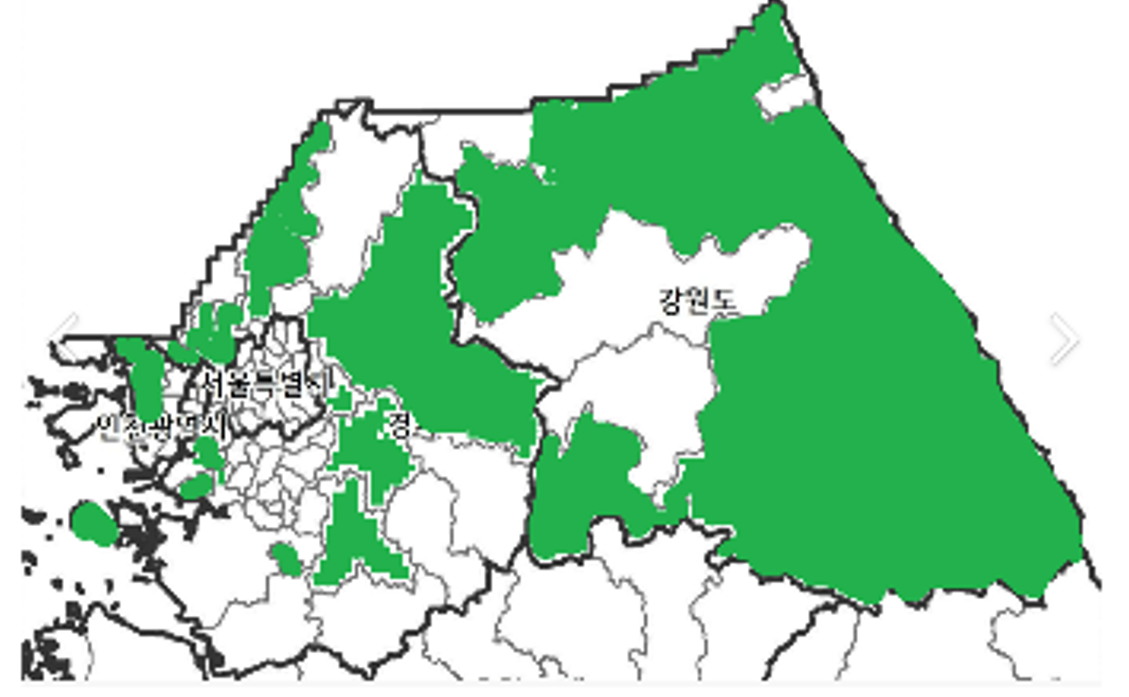
🧠 6.7 Overall Interpretation of Results
2017 |
2023 |
The clustering results reveal clear regional differences in malaria incidence patterns. By combining clustering analysis with multiple linear regression and decision tree analysis, this study identified the key environmental and socioeconomic factors associated with malaria occurrence. The analysis of the 2017 dataset indicates that agricultural land structure played the most important role in explaining malaria incidence. In particular, paddy field area was identified as the dominant factor, as rice paddies provide suitable breeding environments for mosquitoes. However, the 2023 analysis revealed a more diversified pattern of determinants across regions. Three major regional structures were identified: urban-adjacent regions, agricultural regions, and livestock or socioeconomic regions. Each cluster shows different environmental and structural characteristics influencing malaria incidence. Overall, the findings suggest that the spatial distribution and determinants of malaria risk have evolved over time. While agricultural factors were dominant in earlier years, recent patterns indicate that multiple environmental and socioeconomic conditions jointly influence malaria occurrence. These results highlight the importance of region-specific malaria prevention and management strategies.
🏙️ 6.8 Future Malaria Risk Prediction (2041–2050)
Using regression coefficients estimated from the 2023 dataset, malaria risk was projected for the period 2041–2050 under future climate scenarios. Climate projection data, including predicted temperature and precipitation, were obtained from the national climate change scenario dataset. The prediction results indicate that Cluster 1 is expected to show the lowest malaria risk, while Cluster 2 and Cluster 3 are projected to exhibit higher risk levels. In particular, Cluster 2 is predicted to have the highest malaria incidence risk during the 2041–2050 period. These results suggest that agricultural regions may remain the most vulnerable areas for malaria occurrence under future climate conditions.
🧮 6.9 Malaria Risk Index Calculation
To identify high-risk and low-risk regions for malaria occurrence, a malaria risk index was calculated by incorporating malaria incidence, medical workforce capacity, and regional mobility factors.
The malaria risk index was defined as follows:
Malaria Risk Index = (Malaria Cases / Number of Medical Staff) × Mobility Weight
This approach considers both healthcare accessibility and population movement, which can influence malaria transmission risk.
Analysis Procedure
-
Data Preprocessing
Seven CSV datasets were integrated. Data corresponding to Seoul, Gyeonggi, Incheon, and Gangwon regions were filtered and matched by regional names. The mobility population for each region was aggregated. -
Mobility Population Normalization
The filtered data were grouped using regional codes and district names. Mobility population data were normalized to ensure comparability across regions. -
Risk Score Calculation
The number of malaria cases was divided by the number of medical staff in each district. The normalized mobility population value was then applied as a weighting factor to calculate the malaria risk score. -
Identification of High and Low Risk Regions
Based on the calculated risk scores, the top five and bottom five districts were selected as high-risk and low-risk regions respectively.
🌿 6.10 Identification of High-Risk and Low-Risk Regions
High-Risk Regions
The analysis identified the following districts as the top five malaria risk regions:
- Icheon-si (Gyeonggi)
- Gimpo-si (Gyeonggi)
- Ganghwa-gun (Incheon)
- Ilsanseo-gu (Goyang, Gyeonggi)
- Manan-gu (Anyang, Gyeonggi)
Most of these districts correspond to Cluster 3 regions identified in the clustering analysis. These areas are typically rural regions with livestock farming activities and environmental conditions favorable for mosquito breeding.
Low-Risk Regions
The bottom five districts with the lowest malaria risk scores were:
- Songpa-gu (Seoul)
- Bundang-gu (Seongnam, Gyeonggi)
- Seocho-gu (Seoul)
- Wonju-si (Gangwon)
- Gangnam-gu (Seoul)
These districts are largely located in metropolitan urban areas corresponding to Cluster 1. Higher healthcare accessibility and urban environmental conditions contribute to lower malaria transmission risk.
🔮 6.11 Environmental Characteristics of Risk Regions
To further understand the differences between high-risk and low-risk regions, several environmental and socioeconomic indicators were analyzed.
Indicators in High-Risk Regions
Sex Ratio High-risk districts are often located near military bases where a higher proportion of male population is present. Previous studies indicate that a large portion of malaria cases in Korea occurs among military personnel.
Cattle Density
The malaria vector mosquito Anopheles sinensis shows a strong preference for feeding on cattle. Therefore, regions with higher cattle density provide favorable environments for mosquito activity.
Paddy Field Ratio
Rice paddies provide ideal breeding environments for mosquitoes. Areas with larger paddy field coverage tend to experience higher malaria transmission risk.
Indicators in Low-Risk Regions
Population Density
Urban regions with high population density tend to have better healthcare accessibility and faster treatment systems, reducing malaria spread.
Average Temperature
Extremely high temperatures can reduce mosquito survival rates and vector activity, which lowers malaria risk.
Precipitation
Heavy rainfall can reduce mosquito activity and limit the movement of flying insects, decreasing the potential transmission of malaria.
🧾 7. Conclusion
This study analyzed the spatial patterns and determinants of malaria incidence across regions using clustering analysis, regression models, and risk index calculations. Several important findings emerged from the analysis. First, the clustering analysis revealed clear regional differences in malaria occurrence. Three distinct regional structures were identified: urban-adjacent regions, agricultural regions, and livestock-related rural regions. Each cluster exhibited different environmental and socioeconomic characteristics associated with malaria incidence. Second, the risk index analysis showed that high-risk regions were mainly concentrated in areas belonging to Cluster 3, which are typically rural regions with livestock farming and agricultural environments. In contrast, low-risk regions were mostly located in urban metropolitan areas corresponding to Cluster 1, where healthcare accessibility and urban infrastructure reduce malaria transmission risk. Third, environmental indicators such as paddy field ratio, cattle density, and sex ratio were strongly associated with higher malaria risk, while high population density, higher temperatures, and higher precipitation levels were associated with lower malaria risk in urban regions. Finally, the future projection analysis suggests that malaria risk patterns may continue to evolve under future climate conditions, highlighting the importance of region-specific malaria prevention strategies. Overall, this study demonstrates that malaria risk is influenced by a combination of environmental, socioeconomic, and spatial factors, and that integrated regional analysis can provide valuable insights for public health planning and disease prevention policies.